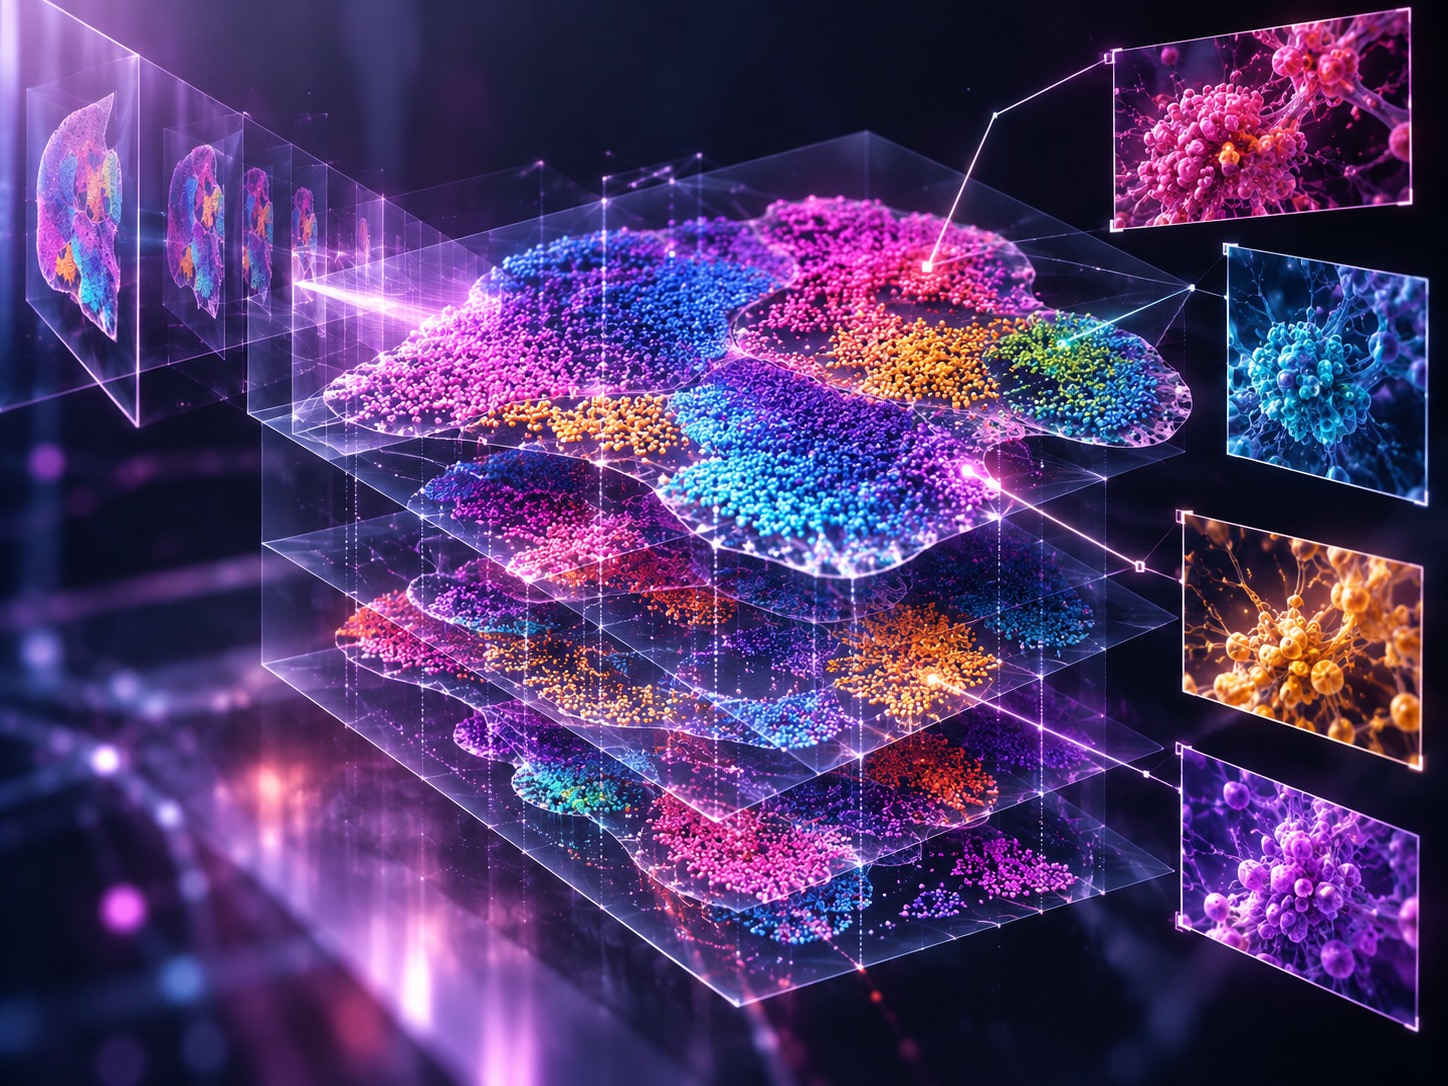
Editor2026-10-05T09:05:02+00:00New Spatial GWAS Atlas Maps Disease Variants to Specific Cells and Tissue RegionsEditor2026-10-05T09:05:02+00:00October 5, 2026|
Editor2026-10-02T09:30:56+00:00In Conversation with Nasir Rajpoot, TIA Centre (University of Warwick) – Episode 3Editor2026-10-02T09:30:56+00:00October 1, 2026|
Branko Perunovic2026-09-28T10:24:25+00:00Forget Location: Part 2, Coherence Without Co-locationBranko Perunovic2026-09-28T10:24:25+00:00September 28, 2026|
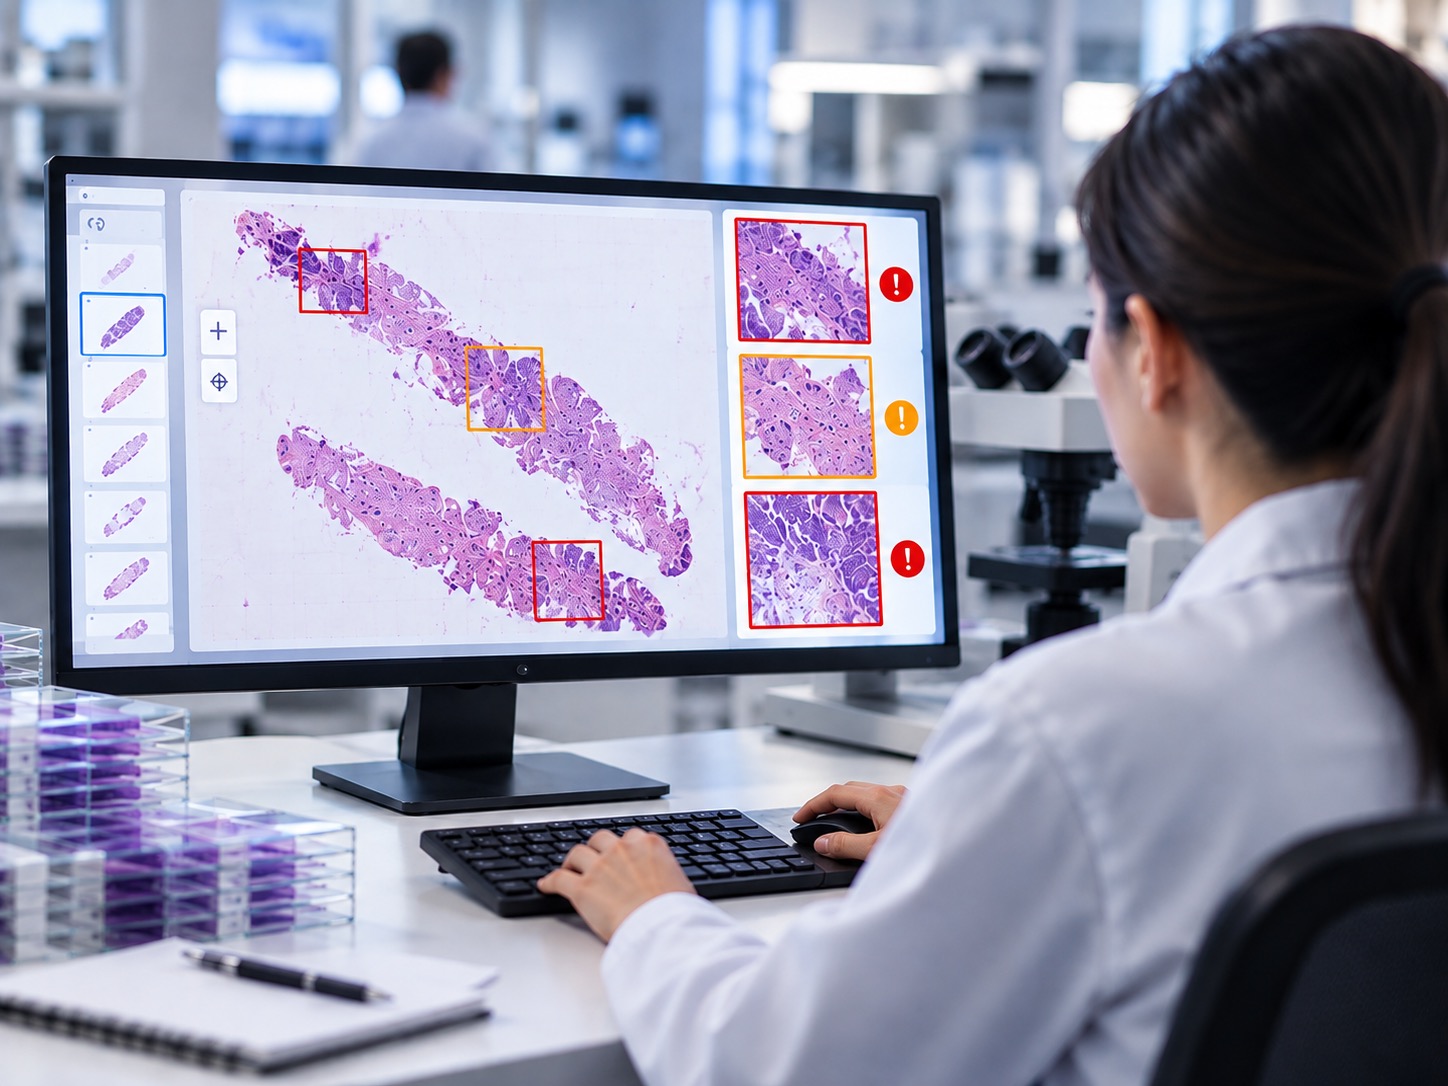
Editor2026-09-29T14:22:22+00:00Real-World Validation of PathProfiler as an Open-Source Tool for WSI Quality ControlEditor2026-09-29T14:22:22+00:00September 28, 2026|
Editor2026-09-29T18:10:53+00:00From digital transformation to AI readiness: University Medical Center Göttingen’s Journey in Digital PathologyEditor2026-09-29T18:10:53+00:00September 25, 2026|
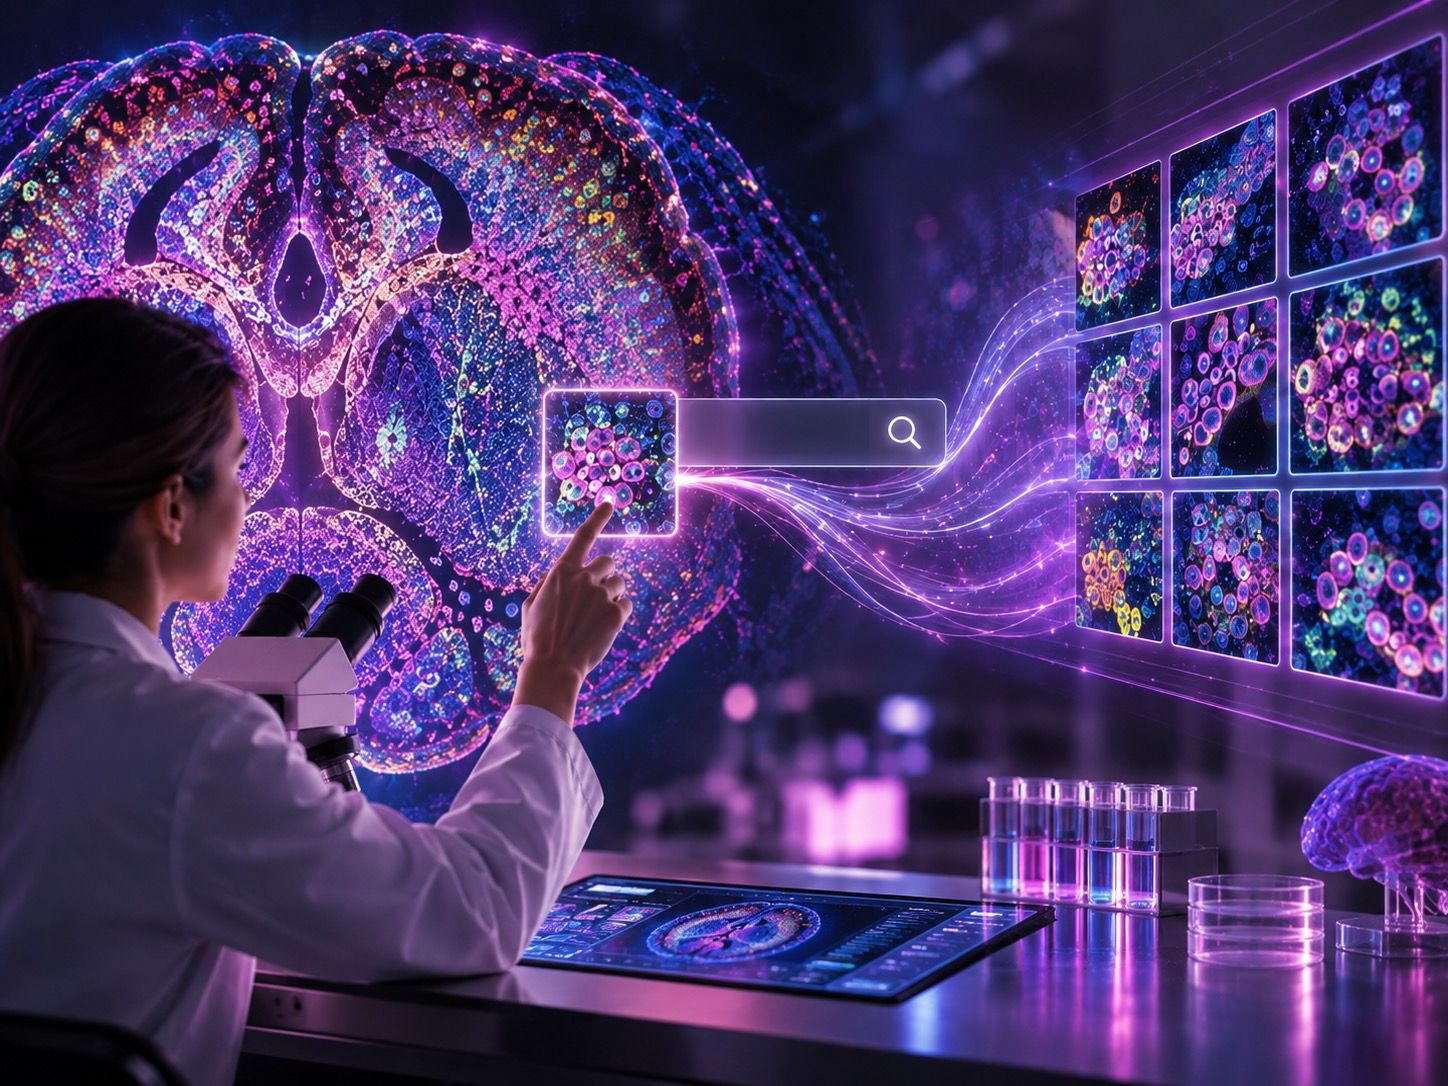
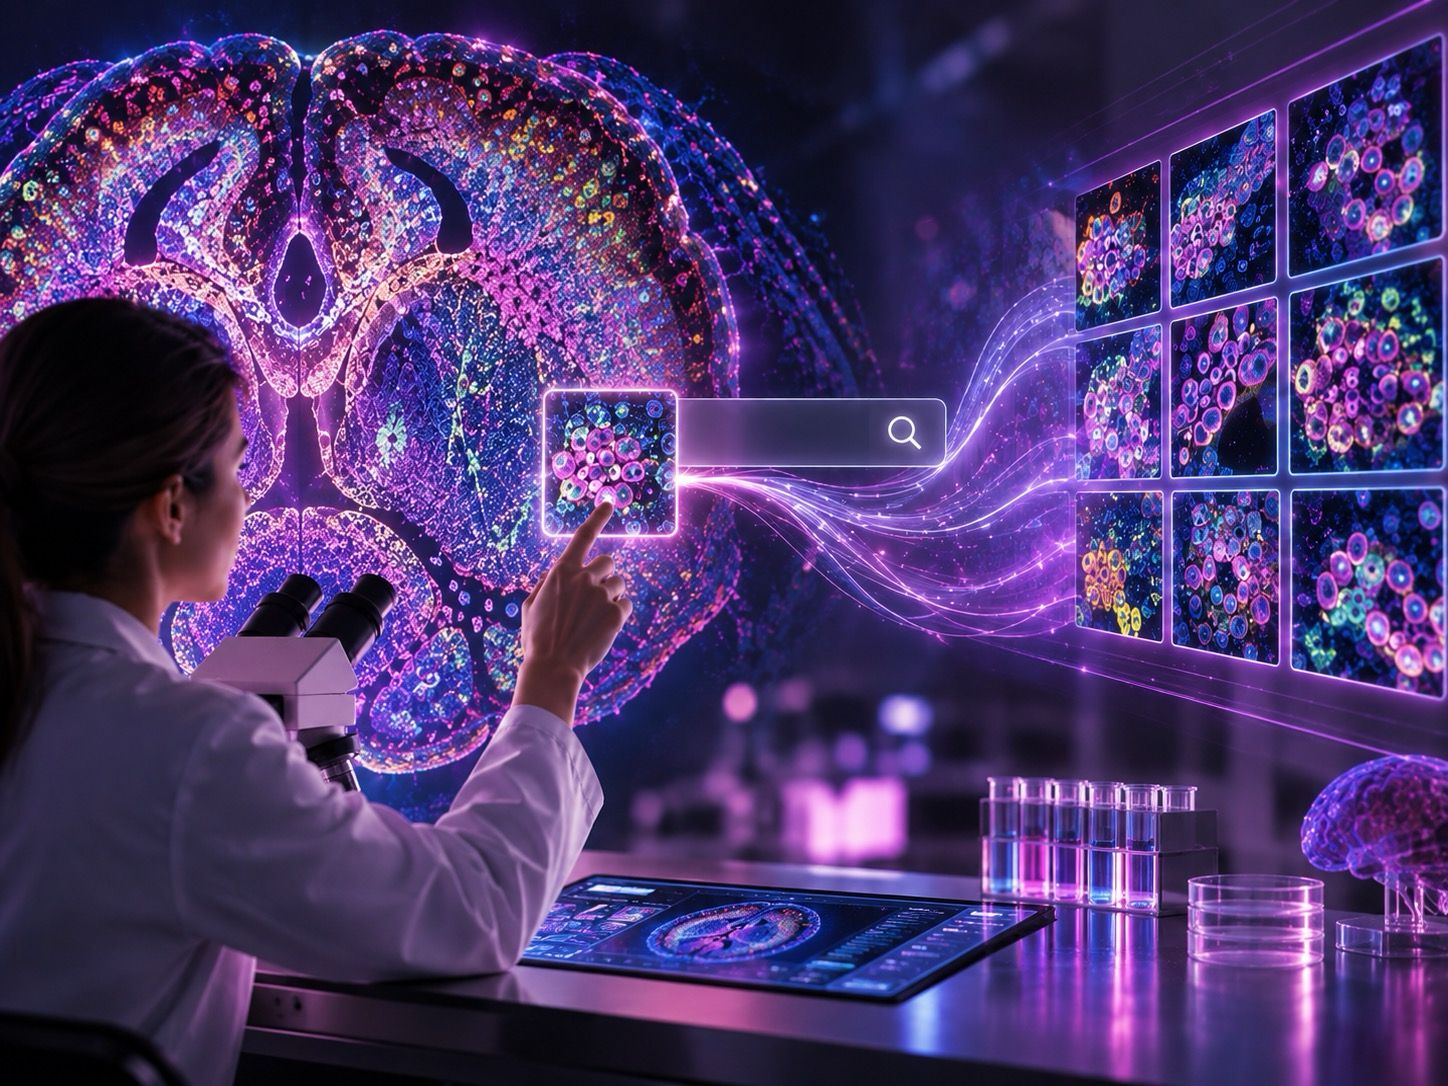
Editor2026-09-23T14:00:42+00:00mViSE: A New Visual Search Engine for Spatial ProteomicsEditor2026-09-23T14:00:42+00:00September 21, 2026|
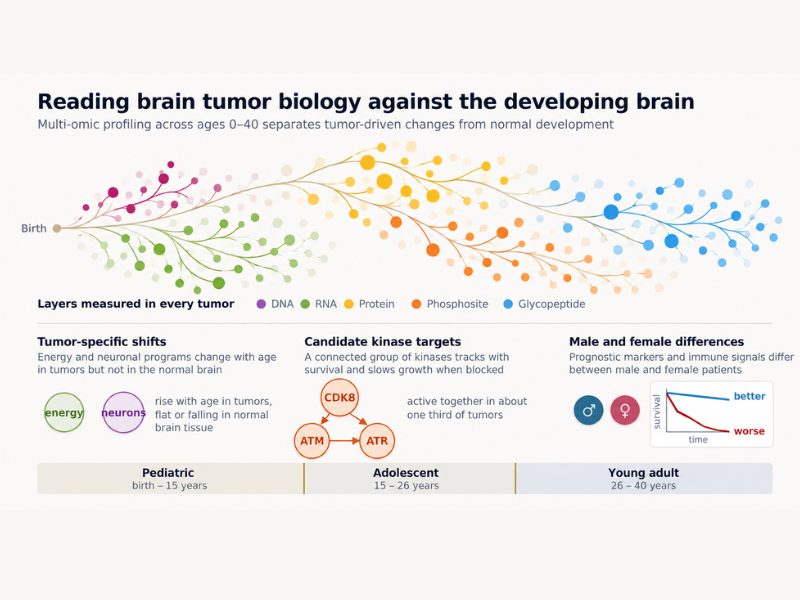
Editor2026-09-18T09:47:40+00:00Study Identifies Candidate Treatment Targets for High-Grade Glioma in Children and Young AdultsEditor2026-09-18T09:47:40+00:00September 18, 2026|
Editor2026-10-02T09:30:58+00:00In Conversation with Nasir Rajpoot, TIA Centre (University of Warwick) – Episode 2Editor2026-10-02T09:30:58+00:00September 17, 2026|
Sidney2026-09-15T11:52:43+00:00What could digital pathology do for me?Sidney2026-09-15T11:52:43+00:00September 15, 2026|
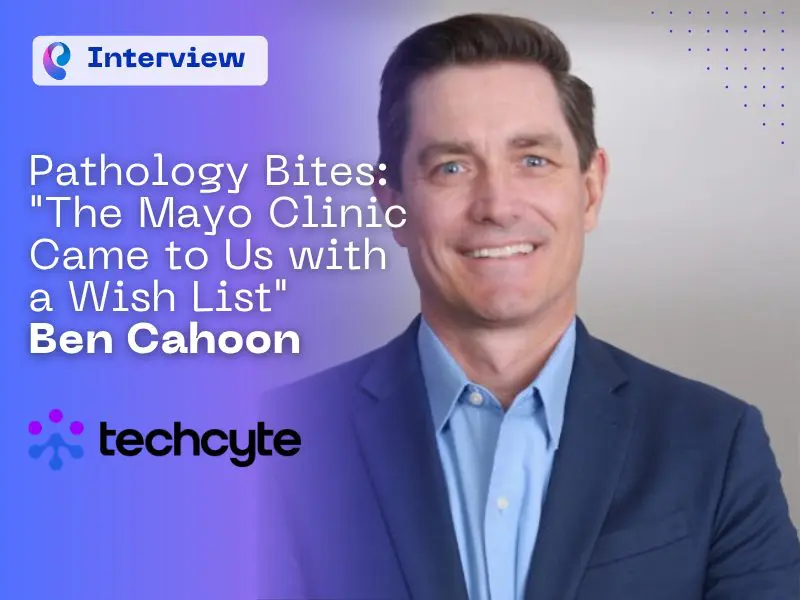
Editor2026-10-05T09:25:22+00:00Pathology Bites: “The Mayo Clinic Came To Us with a Wishlist” Ben CahoonEditor2026-10-05T09:25:22+00:00September 15, 2026|
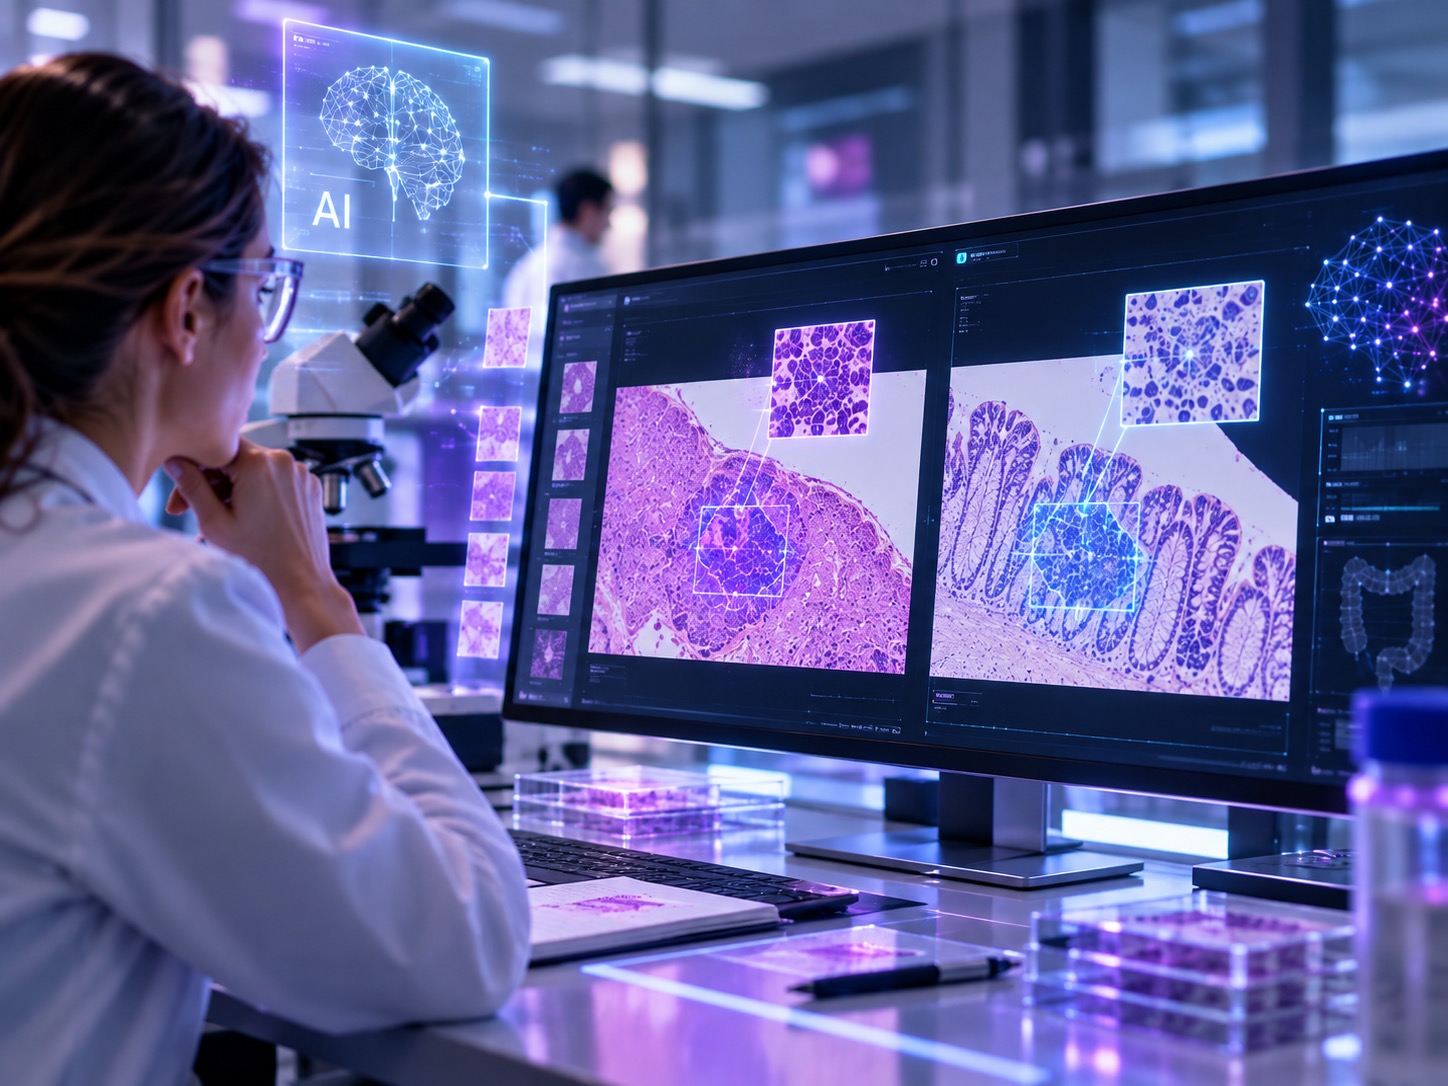
Editor2026-09-14T08:03:38+00:00AI Model Predicts Mismatch Repair Deficiency From Both Tumor and Non-Tumorous Regions in Colorectal CancerEditor2026-09-14T08:03:38+00:00September 14, 2026|