
Dell Displays

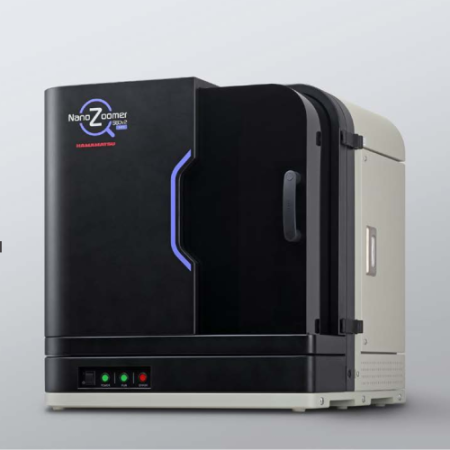
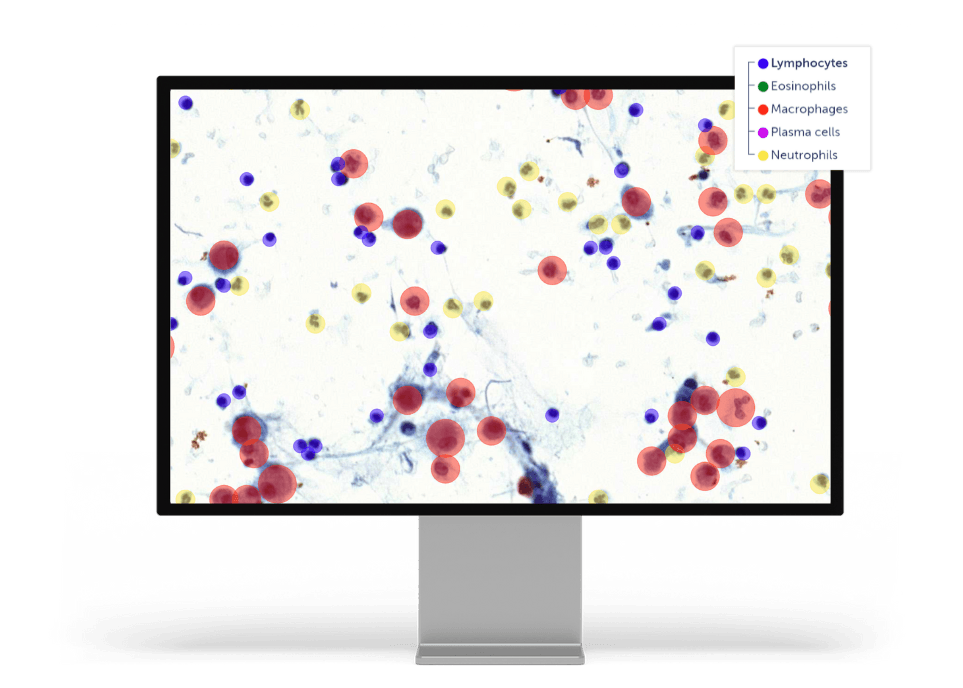
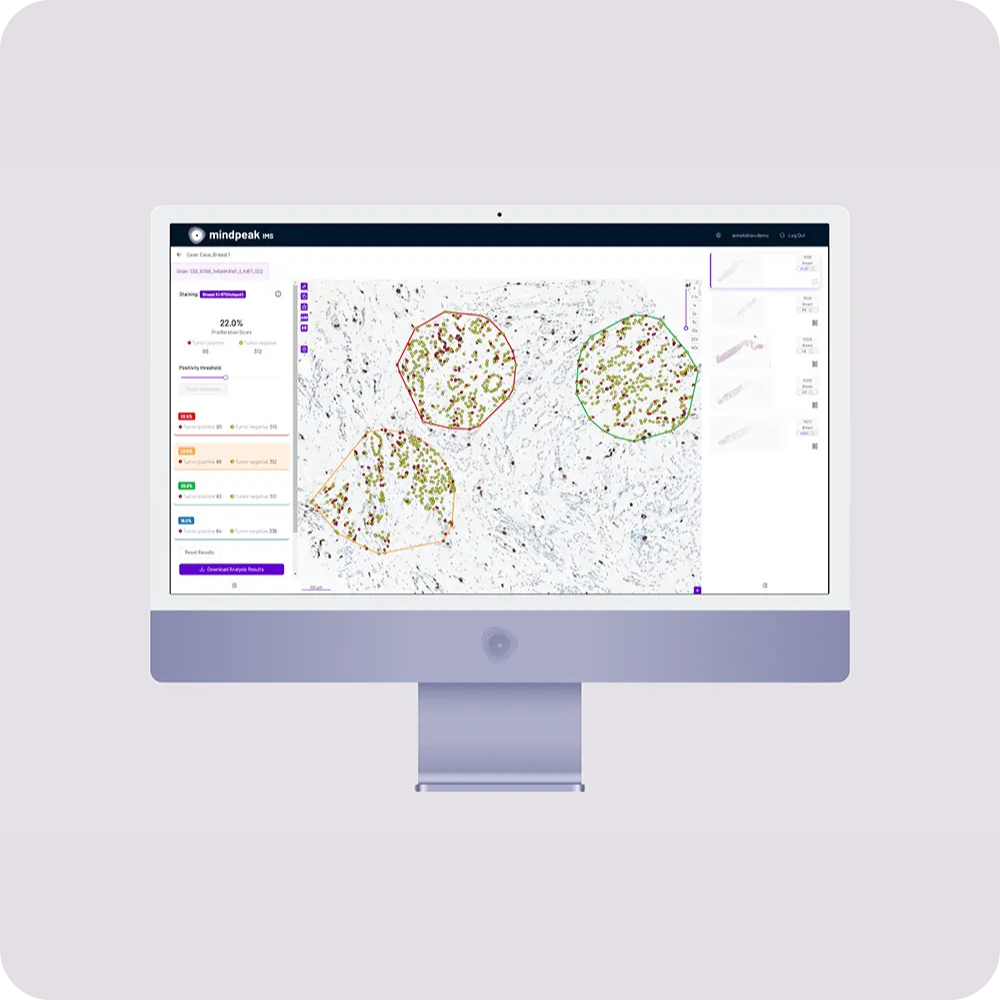
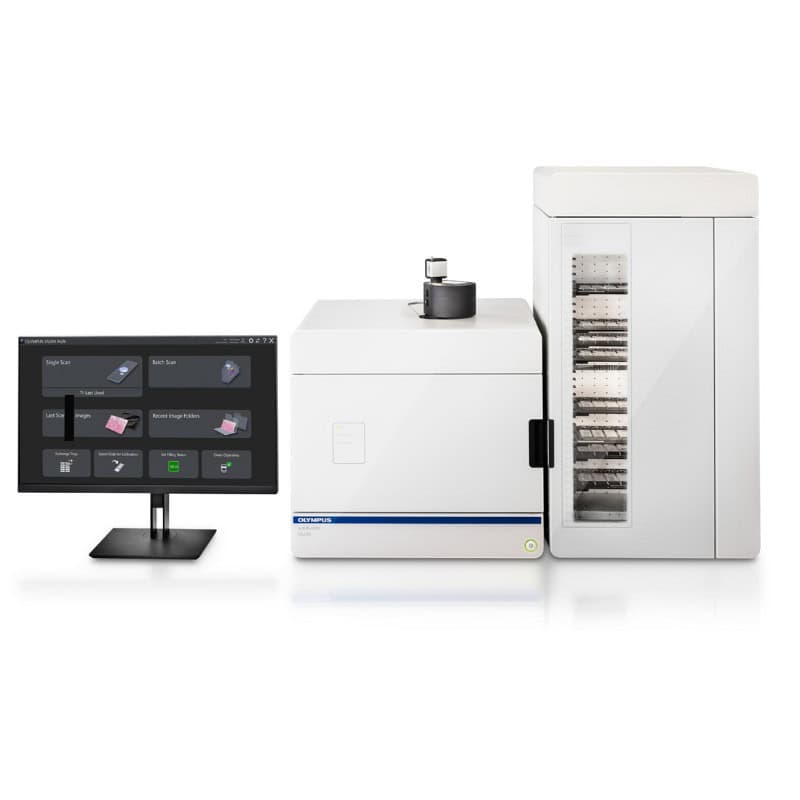
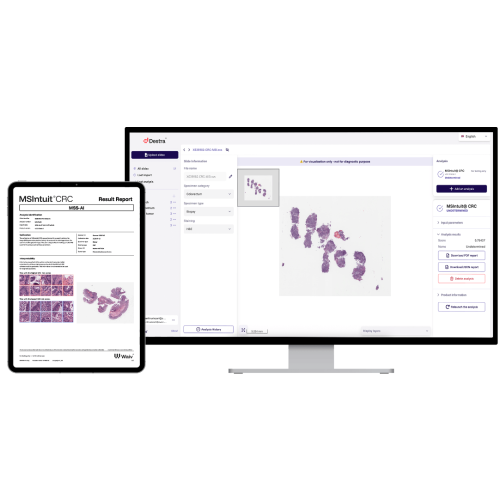
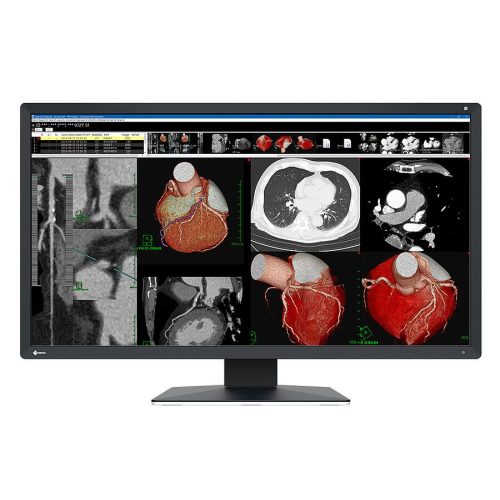
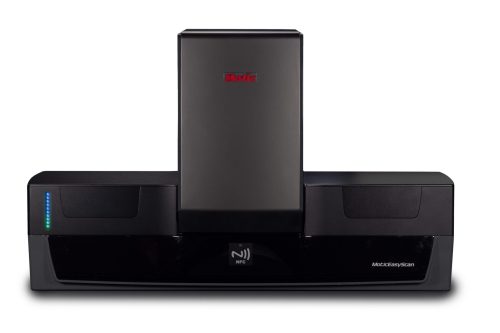
Dell displays deliver reliable, high-quality visual performance for professional healthcare environments, supporting the clear and detailed viewing of clinical information, images and data. With a range of screen sizes, resolutions and connectivity options, Dell displays can support diverse healthcare workflows while helping create efficient, comfortable and productive workstations.

Be the first to review “Dell Displays” Cancel reply
More Solutions from More Solutions
Compare Solutions
No products to compare
Get Pathology News Delivered to Your Inbox
Learn More
More Stories News
Editor2026-08-18T13:34:58+00:00
Meet Phaet and Mascaret: two pathology foundation models built to generalize across labs
Editor2026-08-18T13:34:58+00:00August 19, 2026|
Editor2026-08-18T08:44:11+00:00
Imagene AI Joins Proscia Ready Partner Alliance to Advance AI-Powered IHC Companion Diagnostics Development
Editor2026-08-18T08:44:11+00:00August 18, 2026|
Editor2026-10-06T07:41:25+00:00
Open-Source Platform Brings High-Resolution Spatial Biology Within Reach of Smaller Labs
Editor2026-10-06T07:41:25+00:00August 17, 2026|
Editor2026-08-14T06:48:56+00:00
Techcyte and elea Bring AI-Native Pathology Reporting into Techcyte FusionⓇ
Editor2026-08-14T06:48:56+00:00August 13, 2026|
Editor2026-08-13T08:46:16+00:00
Pathologic Characterization of Non-Mass Enhancement Lesions of the Breast in MRI-guided Biopsy
Editor2026-08-13T08:46:16+00:00August 13, 2026|
Editor2026-08-27T12:13:53+00:00
OnePath Diagnostic Now Runs on elea’s AI-Native Pathology Operating System
Editor2026-08-27T12:13:53+00:00August 13, 2026|
Editor2026-08-12T08:47:23+00:00
A multisite survey on patient perspectives of breast cancer risk assessment and supplemental breast cancer screening tools
Editor2026-08-12T08:47:23+00:00August 12, 2026|


![Figure 1: Fine-tuning improves robustness and performance jointly. Each foundation model is shown before (open circle) and after (filled circle) fine-tuning. The x-axis is the average PathoROB robustness index over three datasets, where higher values indicate greater robustness; the y-axis is the normalized rank sum over the HEST, THUNDER and Patho-Bench benchmarks, rescaled to [0, 1] so that 1 corresponds to the best achievable performance.](https://www.pathologynews.com/wp-content/uploads/2020/07/embedding-figure-800x600-1.png)






Reviews
There are no reviews yet.