by Christos Evangelou, MSc, PhD – Medical Writer and Editor
In a recent study, an international group of researchers, in collaboration with Histoindex Pte Ltd, applied second harmonic generation (SHG) microscopy with artificial intelligence (AI) to gain insights into the progression and regression of liver scarring in patients with metabolic dysfunction-associated steatohepatitis (MASH).1 The study showed that advanced digital pathology techniques can reveal changes in liver fibrosis that conventional methods miss.
The report was published in Liver International.
Limitations of Current Methods for Assessing Liver Fibrosis
Liver fibrosis, the accumulation of scar tissue in the liver, is a critical factor in determining the prognosis of patients with chronic liver disease.1 In recent years, MASH has emerged as a leading cause of liver fibrosis, driven by the global obesity epidemic. The conventional histopathology approach for assessing liver fibrosis relies on semi-quantitative scoring systems that categorize the severity of liver fibrosis into broad stages. However, these systems are subjective and often fail to capture subtle changes in fibrosis, particularly when evaluating treatment responses or disease progression within a single stage.1
Prof. Nikolai V. Naoumov, the lead author from University College London, explained their rationale for using SHG/TPEF microscopy with AI:
“SHG digital pathology, coupled with AI analyses, delivers unparalleled precision and granularity in quantifying tissue collagen in its natural, unstained state. This technology reveals new insights into the balance between fibrogenesis and fibrinolysis, bringing new knowledge and in-depth understanding of disease evolution and treatment outcomes.”
Combining SHG/TPEF Microscopy With AI
The study included 57 patients with MASH and bridging fibrosis (stage F3) who participated in a clinical trial of tropifexor, a non-bile acid FXR agonist, as an experimental drug for MASH treatment. Liver biopsies were taken at baseline and after 48 weeks of treatment with either tropifexor or a placebo.1
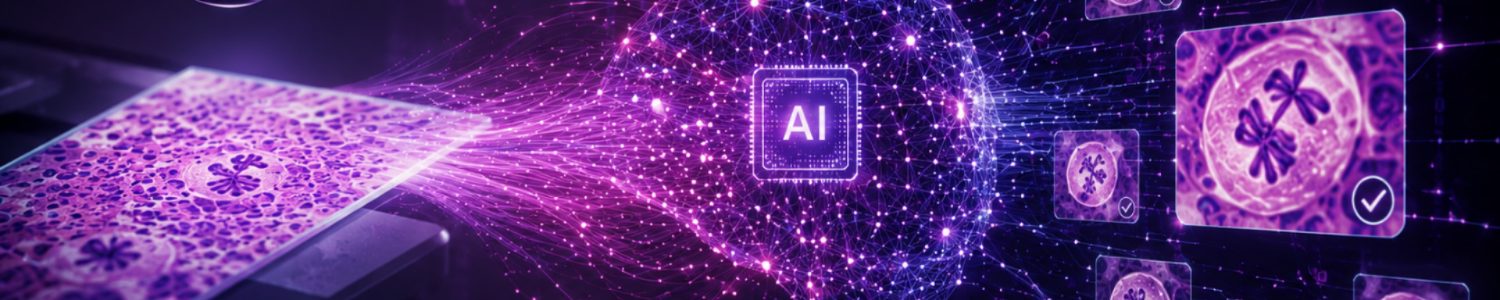
The researchers used SHG microscopy with two-photon excitation fluorescence (TPEF) to visualize collagen fibers and additional structural information about the tissue without the need for tissue staining.1 After imaging the liver biopsies, the team used proprietary Histoindex-developed AI software to analyze the microscopy images and quantify various parameters of liver fibrosis.1 The amount, topography, and architecture of collagen fibers in the liver biopsy were determined by quantitative assessment of individual collagen features as qFibrosis, a cumulative index measuring more than 100 collagen parameters on a continuous scale.
Prof. Naoumov highlighted the key advantages of this approach:
“SHG/TPEF microscopy uses unstained tissue, allowing for the quantification of collagen characteristics and fibrosis without staining or chemical modification of collagen fibers. Additionally, this approach overcomes the limitations of subjective liver fibrosis scoring, which typically uses a simplistic 0 to 4 scale prone to inter- and intra-observer variability, by offering a linear quantitation with standardized, reproducible readouts.”
Greater Sensitivity to Fibrosis Changes
The digital pathology approach using qFibrosis detected fibrosis progression or regression in 14 of 17 (82%) placebo-treated patients, while conventional histology scoring categorized 11 of 17 (65%) placebo-treated patients as ‘no change’.1 In addition, while all patients in the study had MASH F3 fibrosis, the quantitation of the average septa area unveiled a significant imbalance between patients randomized to receive the investigational compound — tropifexor or placebo, which highlights the need to use precise quantitation of qFibrosis in clinical trials. The study identifies clinically useful measurements for objective differentiation of progressive vs regressive bridging septa, which can be a basis for better patient stratification and randomization in clinical studies. According to Prof. Naoumov, this finding demonstrates the superior sensitivity of the digital pathology method in capturing fibrosis dynamics.
“This finding highlights the need for using precise quantitation of qFibrosis in clinical trials,”
he added.
In addition, the researchers developed “radar maps” to visualize changes in fibrosis across different regions of the liver lobule. Quantitative fibrosis mapping revealed distinct patterns of fibrosis progression or regression, even in cases where conventional scoring showed no change.1
Detailed Septa Analysis
The research team introduced 12 specific parameters for analyzing fibrous septa, the bridges of scar tissue between liver structures. SHG/TPEF microscopy combined with AI distinguished between progressive and regressive fibrous septa based on the quantitation of these 12 septa parameters, including septa area, width, length, and cellularity, and the presence of collagen fibers within the septa.1 According to Prof. Naoumov, this approach moves beyond the subjective descriptions typical of conventional microscopy.
Treatment Response Insights and Predictive Potential
In patients treated with tropifexor, the digital analysis revealed significant reductions in several fibrosis parameters, even in cases where conventional scoring showed no change.1 This finding suggests that the new method may be more sensitive in detecting early treatment responses.
The researchers also found that certain baseline fibrosis parameters, particularly those related to portal tract collagen, might predict which patients are more likely to experience fibrosis regression with treatment.1
According to Prof. Naoumov, the increased sensitivity in detecting fibrosis changes could lead to more efficient drug trials, potentially reducing the time and cost of bringing new treatments to market.
“In MASH trials, where histopathological assessment of liver biopsies is mandatory for assessing the primary endpoints for accelerated drug approval, our findings extend the growing body of evidence that the standard categorical semi-quantitative histologic scoring systems are inadequate for determining liver fibrosis progression and regression. The results of the study advocate for integrating digital pathology with AI quantitation in liver biopsy assessments as an aid to pathologists. The use of qFibrosis has already been shown to substantially improve the interrater concordance in comparison to the review without digital pathology input,”
he noted.
Prof. Naoumov also emphasized the broader applicability of this approach:
“The fibrosis parameters evaluated in this study — qFibrosis overall and in different areas of liver lobules, as well as individual septa parameters — apply to liver fibrosis of any etiology and demonstrate the overarching applicability of this approach.”
Study Limitations and Future Directions
Although the results support the superiority of qFibrosis over conventional scoring in detecting fibrosis progression, Prof. Naoumov acknowledged the relatively small number of patients with MASH F3 fibrosis and the short follow-up duration of 48 weeks. “A larger cohort with extended follow-up, possibly a third biopsy, could provide a deeper understanding of individual septa parameters as predictors of outcome,” he stated.
Prof. Naoumov concluded with his vision of a future where
“digital pathology with AI is transforming the assessment of liver histology by providing an invaluable aiding tool to pathologists in achieving standardized, detailed quantification and comprehensive analyses of collagen deposition, ultimately allowing to break away from the subjective staging of fibrosis burden.”
Digital pathology with AI will augment the capabilities of pathologists, but it will not replace them, and the integration of new technologies will complement and enhance human expertise, he added.
This study received financial support from the National Institutes of Health, National Cancer Institute; Novartis Pharma AG; and HistoIndex Pte. Ltd.
References
- Naoumov NV, Kleiner DE, Chng E, et al. Digital quantitation of bridging fibrosis and septa reveals changes in natural history and treatment not seen with conventional histology. Liver Int. Published online September 9, 2024. doi:10.1111/liv.16092
No audio available for this article yet.
No quiz available for this article yet.