by Christos Evangelou, MSc, PhD – Medical Writer and Editor
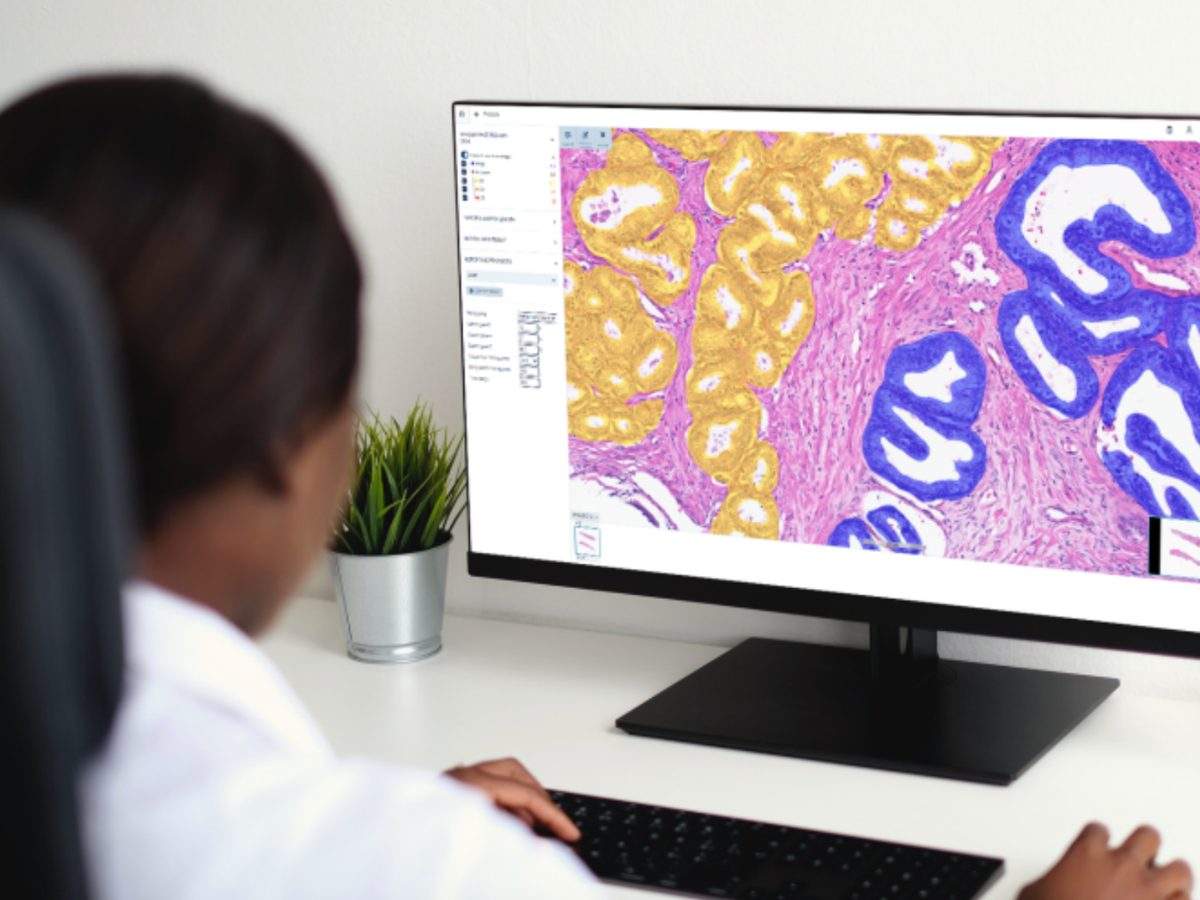
Researchers at the Affiliated Hospital of Guangdong Medical University in China developed an automated, open-source machine learning algorithm to quantify tumor-infiltrating lymphocytes (TILs) on standard H&E slides. Using an optimal TIL cut-off to stratify patients into high- and low-density groups, the researchers were able to predict immune status and overall survival in patients with lung adenocarcinoma.
The study was published in Scientific Reports.
Why Is Counting Lymphocytes by Eye Is No Longer Good Enough?
In non-small cell lung cancer, TILs have been recognized as both prognostic markers and potential predictors of immunotherapy response. Fasheng Li, MD, a corresponding author of the study, explained that the problem is how TILs are measured. Current methods of TIL evaluation require a pathologist to visually assess TIL levels on H&E-stained slides, which is subjective, time consuming, and difficult to reproduce across observers and institutions.
“We were motivated by the need to develop a reproducible, quantitative, and scalable approach that could translate routine pathology images into objective immune metrics with clinical relevance,” Li stated in an interview with Pathology News.
To address this gap, the research team developed and validated an automated method for TIL quantification using freely available software and integrating image-derived metrics with transcriptomic and genomic data from The Cancer Genome Atlas (TCGA).
How Does the Pipeline Work?
The team built their system on QuPath, a widely used open-source digital pathology platform, applied to 304 high-quality H&E whole-slide images of lung adenocarcinoma selected from an initial pool of 1,067 TCGA cases. Normal tissues, duplicate sections, and slides with motion artifacts were excluded.
“We developed an automated workflow using QuPath to segment and classify cells on H&E-stained whole-slide images,” Li explained. “After identifying tumor, stromal, and lymphocytic components, we quantified TIL density.”
The workflow began with per-image stain normalization to reduce variability caused by differences in H&E staining protocols. Cells were then segmented using watershed-based detection tuned to nuclear morphology. For each detected cell, the pipeline extracted Haralick texture features, which capture information about local image texture that helps discriminate between cell types.
A supervised classifier was trained iteratively, with two board-certified pathologists reviewing and correcting misclassified cells until a satisfactory model was achieved. The final model categorized each cell as a tumor cell, stromal cell, or TIL, and computed densities for each type in cells per square millimeter.
“In a subsequent step, we trained a random forest model based on aggregated Haralick texture features and tumor stage to classify patients into high- and low-TIL subgroups,” Li explained. “We then integrated these image-derived metrics with transcriptomic and genomic data from TCGA to explore biological and prognostic associations.”
Automated TIL Quantification Predicts Overall Survival
Automated TIL quantification showed moderate concordance with manual TIL counts determined by pathologists (intraclass correlation coefficient [ICC] = 0.72). The median TIL density across the cohort was 72.5 cells/mm², with high heterogeneity (range up to 1,061 cells/mm²). On average, TILs comprised 1.6% of all detected cells.
Using maximally selected rank statistics on the training set (n = 204), the team identified an optimal TIL density cut-off of 135 cells/mm², which was applied to the validation set. High TIL density was significantly associated with better overall survival in both the training cohort (Cox hazard ratio [HR], 0.52; 95% CI, 0.29–0.95; P = 0.035) and the validation cohort (HR, 0.39; 95% CI, 0.16–0.97; P = 0.044). The association between high TIL density and improved overall survival was also significant in the combined cohort of all 304 patients (HR, 0.48; 95% CI, 0.29–0.79; P = 0.004).
Automated TIL Quantification Predicts Tumor Biology
Single-sample gene set enrichment analysis (ssGSEA) demonstrated that high-TIL tumors were enriched in activated B cells, CD8+ cytotoxic T lymphocytes, effector CD4+ T cells, and dendritic cells. ESTIMATE scores confirmed that the immune score and composite ESTIMATE score were higher in the TIL-high group, whereas stromal scores did not differ.
Gene set variation analysis showed that tumors with a low TIL density were enriched in ribosome biogenesis, cytoplasmic translation, and rRNA metabolic processes. Weighted gene co-expression network analysis identified the magenta module (enriched for CD8A, HLA family members, and B2M) as positively correlated with the high-TIL group, whereas the yellow module (dominated by ribosomal proteins including RPS27A) correlated with the low-TIL group.
“One interesting observation was the clear transcriptional divergence between high- and low-TIL tumors, particularly the enrichment of ribosome-related pathways in low-TIL tumors, highlighting distinct tumor microenvironment states,” Li noted.
TIL-high tumors had a broader spectrum of mutations and higher per-gene frequencies in genes such as CD163, KCNK9, and NINL. Drug sensitivity predictions showed no significant differences between TIL-high and TIL-low groups for standard chemotherapies or targeted agents. However, BI-2536, leflunomide, and WEHI-53 showed different predicted IC50 distributions between TIL-high and TIL-low tumors.
Implications of Study Findings
Although the study does not yet provide a validated clinical test and the TCGA cohort lacks immunotherapy treatment data, the findings raise the question of whether automated TIL quantification from routine H&E slides, which are available for all patients with lung cancer, can become a cost-effective immune biomarker.
“Our results suggest that quantitative TIL assessment from routine H&E slides may serve as a cost-effective and scalable biomarker reflecting tumor immune status,” Li argued. “Although our study is not based on an immunotherapy-treated cohort, the strong association with immune activation signatures supports the hypothesis that image-derived TIL metrics may help stratify patients for immunotherapy in future prospective studies.”
Limitations and What Comes Next
The authors acknowledge that the external single-center validation cohort of 93 patients is small and did not include patients treated with immune checkpoint inhibitors, leaving open questions about the predictive value of the pipeline for immunotherapy response. The pipeline also quantifies TIL density at the whole-slide level, missing potentially important spatial information such as TIL distribution or regional immune hot spots.
“External validation across multi-center cohorts and prospective studies in immunotherapy-treated patients is an important next step,” Li acknowledged.
Li also pointed to the potential of incorporating spatial context, such as distinguishing intratumoral versus stromal TILs or modeling immune-tumor proximity, to further refine biological insight and predictive value.
“We believe that open-source computational pathology tools can help bridge the gap between routine histopathology and precision oncology,” Li said. “Our goal is to contribute to a more standardized and interpretable framework for translating H&E images into clinically actionable information.”
This project was supported by the Key Clinical Projects of Affiliated Hospital of Guangdong Medical University (LCYJ2022DL003), the Supported Projects of Zhanjiang (2021A05076), and the Zhanjiang Science and Technology Plan Project (2010H20190029).
References
- Li A, Pang Y, Zhang H, et al. Automated quantification of tumor-infiltrating lymphocytes by machine learning reveals prognostic and immunogenomic features in lung cancer. Sci Rep. 2026;16(1):7006. Published 2026 Feb 2. doi:10.1038/s41598-026-37076-y
No audio available for this article yet.
No quiz available for this article yet.