Editor2026-08-19T09:13:31+00:00The Pathology Portal celebrates its four year anniversary.Editor2026-08-19T09:13:31+00:00August 19, 2026|
Editor2026-08-18T13:34:58+00:00Meet Phaet and Mascaret: two pathology foundation models built to generalize across labsEditor2026-08-18T13:34:58+00:00August 19, 2026|
Editor2026-08-18T08:44:11+00:00Imagene AI Joins Proscia Ready Partner Alliance to Advance AI-Powered IHC Companion Diagnostics DevelopmentEditor2026-08-18T08:44:11+00:00August 18, 2026|
Editor2026-08-17T09:19:14+00:00Open-Source Platform Brings High-Resolution Spatial Biology Within Reach of Smaller LabsEditor2026-08-17T09:19:14+00:00August 17, 2026|
Editor2026-08-14T06:48:56+00:00Techcyte and elea Bring AI-Native Pathology Reporting into Techcyte FusionⓇEditor2026-08-14T06:48:56+00:00August 13, 2026|
Editor2026-08-13T08:46:16+00:00Pathologic Characterization of Non-Mass Enhancement Lesions of the Breast in MRI-guided BiopsyEditor2026-08-13T08:46:16+00:00August 13, 2026|
Editor2026-08-14T06:49:00+00:00OnePath Diagnostic Now Runs on elea’s AI-Native Pathology Operating SystemEditor2026-08-14T06:49:00+00:00August 13, 2026|
Editor2026-08-12T08:47:23+00:00A multisite survey on patient perspectives of breast cancer risk assessment and supplemental breast cancer screening toolsEditor2026-08-12T08:47:23+00:00August 12, 2026|
Editor2026-08-10T07:51:40+00:00Keeping Digital Pathology Open: The Regulatory Framework Behind Concentriq AP-DxEditor2026-08-10T07:51:40+00:00August 12, 2026|
Editor2026-08-11T14:54:03+00:00Lumea Climbs the 2026 Inc. 5000 Ranking, Reflecting Continued Rapid GrowthEditor2026-08-11T14:54:03+00:00August 11, 2026|
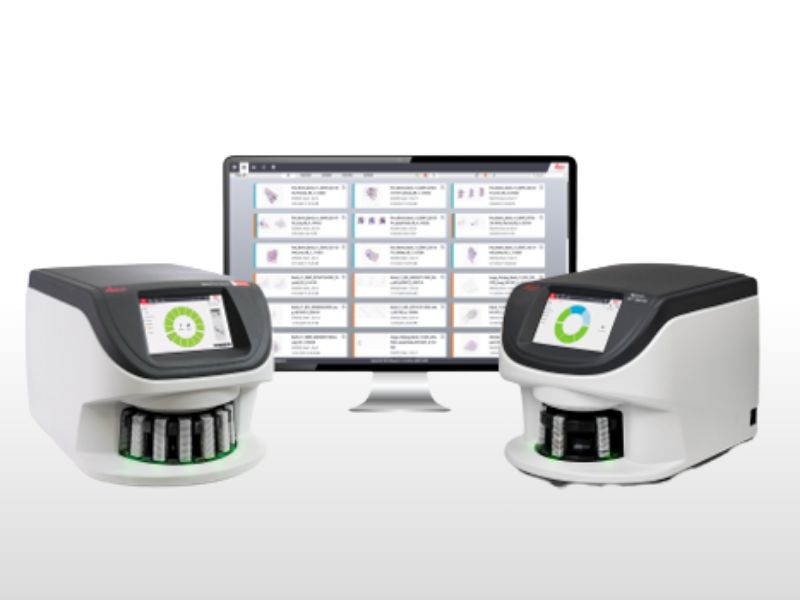
Editor2026-08-11T13:08:19+00:00Leica Biosystems Enables Faster Cancer Diagnoses Through Multiple Digital Pathology FDA Clearances, Including Industry-First AI-Assisted Quality Control SoftwareEditor2026-08-11T13:08:19+00:00August 11, 2026|

![Figure 1: Fine-tuning improves robustness and performance jointly. Each foundation model is shown before (open circle) and after (filled circle) fine-tuning. The x-axis is the average PathoROB robustness index over three datasets, where higher values indicate greater robustness; the y-axis is the normalized rank sum over the HEST, THUNDER and Patho-Bench benchmarks, rescaled to [0, 1] so that 1 corresponds to the best achievable performance.](https://www.pathologynews.com/wp-content/uploads/2020/07/embedding-figure-800x600-1.png)