by Christos Evangelou, MSc, PhD – Medical Writer and Editor
Although genome-wide association studies (GWAS) have identified thousands of disease-associated variants, most reside in noncoding regions whose effects remain poorly understood. Now, researchers at the Changping Laboratory in Beijing have launched a spatial database called Spatial GWAS Atlas that integrates GWAS data with spatial transcriptomics to systematically connect disease-related genetic variants to their locations within tissue architecture. According to the authors, the Spatial GWAS Atlas could help clinicians better understand disease mechanisms and identify therapeutic targets.
The study was published in Nucleic Acids Research.
Study Rationale
GWAS have improved our understanding of disease genetics over the past two decades by identifying variants linked to traits and diseases. However, many disease-associated variants influence gene regulation in different tissues without altering protein sequences.
"Complex traits are shaped by genetic effects that vary across tissues, regions, and cell types," explained Yajie Zhao, PhD, the corresponding author of the study. "Even though GWAS provide broad associations and single-cell datasets reveal cellular heterogeneity, there has been a lack of integrative resources linking genetic variation to spatially resolved tissue contexts."
Previous efforts to connect GWAS data to cells and tissues have relied on single-cell RNA sequencing. Although this approach can reveal which cell types are involved in a disease, it does not provide spatial information, such as anatomical location or neighboring cells. The researchers developed the Spatial GWAS Atlas to bridge this gap by enabling researchers to see not only which cell types harbor disease risk, but also where those cells are located within tissue architecture.
Mapping Genetics Onto Tissues
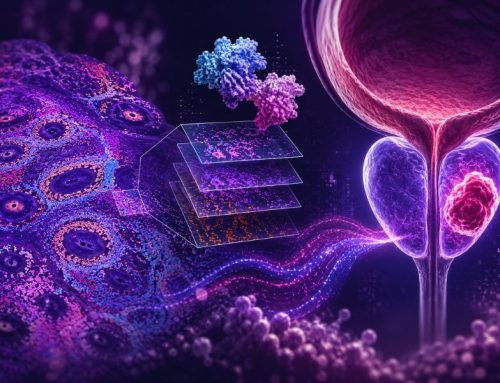
The GWAS Atlas combines 3,854 GWAS datasets with 635 spatial transcriptomics datasets across human, mouse, and macaque tissues, yielding over 1.7 million trait-region associations. The atlas builds on a genetically informed spatial mapping framework called gsMap, which integrates spatial transcriptomics data with GWAS summary statistics.
"A graph neural network identifies homogeneous spots based on gene expression and spatial positions," Zhao explained. "Gene specificity scores are calculated for each spot to represent relative gene expression."
The gene specificity scores are mapped to genetic variants within 50 kilobases of each gene and incorporate epigenomic data to link variants to their likely target genes. The team used stratified linkage disequilibrium score regression to determine whether genetic variants in highly expressed genes disproportionately contribute to disease heritability. Finally, statistical methods aggregate individual spot-level associations to quantify the relationship between entire tissue regions and specific traits.
To match each of the 3,854 traits to tissues for analysis, the team developed a semi-automated ontology-driven strategy that queries the Experimental Factor Ontology, with manual curation for ambiguous cases. Traits without clear tissue associations default to embryonic datasets.
The database contains 68 million spatial spots across ten tissue types. The brain tissue contains 56% of all spots, and embryonic spatial transcripts represented 41% of all data. The platform incorporates data from multiple spatial transcriptomics technologies, including Stereo-seq, 10x Visium, and MERFISH, and draws GWAS data from major biobanks, including UK Biobank, FinnGen, and the Million Veteran Program.
Schizophrenia Risk Concentrates in Specific Brain Regions
The research team analyzed a high-resolution spatial transcriptomics dataset of the entire mouse brain, focusing on schizophrenia, a condition for which genetic risk factors have been identified, but their cellular and anatomical specificity remains incompletely understood.
"Schizophrenia-associated cells were enriched in brain tissue and specifically in neurons," Zhao stated. "Spatially, these cells are concentrated in the cerebral cortex, hippocampus, and thalamus."
Zhao explained that these findings from the Spatial GWAS Atlas add single-cell, spatially resolved validation of previous neuroimaging and genetic studies showing an association between reduced hippocampal subfield volumes and cognitive impairment in individuals with schizophrenia.
Potential Clinical Implications
Zhao emphasized that understanding which cells and tissue regions harbor genetic variants could inform the development of targeted therapies.
"By linking genetic variants to spatially and cellularly resolved contexts, the atlas supports identification of tissue- or cell type-specific therapeutic targets and biomarkers, advancing precision medicine approaches," Zhao explained. "This spatial resolution can help researchers pinpoint where genetic risk manifests within complex tissue architecture and how local microenvironments shape these effects."
The atlas could also be used to refine patient stratification approaches. If certain genetic variants are located in specific tissue regions, biomarkers derived from those regions might better predict treatment response or disease progression than broad genetic risk scores alone.
Future Work
The researchers acknowledge that spatial transcriptomics coverage remains uneven across tissues, and that, although the brain is relatively well represented, many human tissues have limited or no high-resolution spatial data. This constrains trait mapping for conditions affecting underrepresented tissues.
Current spatial transcriptomics platforms do not yet achieve true single-cell resolution universally; therefore, some spot-level associations may reflect composite signals from heterogeneous cell populations. In addition, all GWAS data in the current release derive from European populations, limiting broader generalizability.
"We plan to expand the atlas by incorporating additional GWAS datasets from diverse populations, integrating multi-omic spatial datasets, and enhancing cross-species comparisons," Zhao revealed. "This will deepen insights into the spatial architecture of complex traits and improve the predictive power of genetic mapping."
The Spatial GWAS Atlas is freely accessible at https://zhaolab.cpl.ac.cn/spatialgwas, with features for keyword searching, multicriteria browsing, interactive visualization, and bulk data download. The platform allows researchers to search for specific traits, tissues, or cell types, and visualize results through integrated plotting tools that display both spatial coordinates and statistical significance.
"We hope the Spatial GWAS Atlas will serve as a versatile resource for the genetics and spatial biology community, fostering discoveries that connect molecular mechanisms to disease phenotypes in their native tissue context," Zhao concluded.
The study received financial support from the Changping Laboratory.
References
- Kang H, Jing X, Lin J, et al. Spatial GWAS Atlas: a knowledgebase for decoding the genetic architecture of complex traits in spatial resolution. Nucleic Acids Res. Published online November 17, 2025. doi:10.1093/nar/gkaf1103