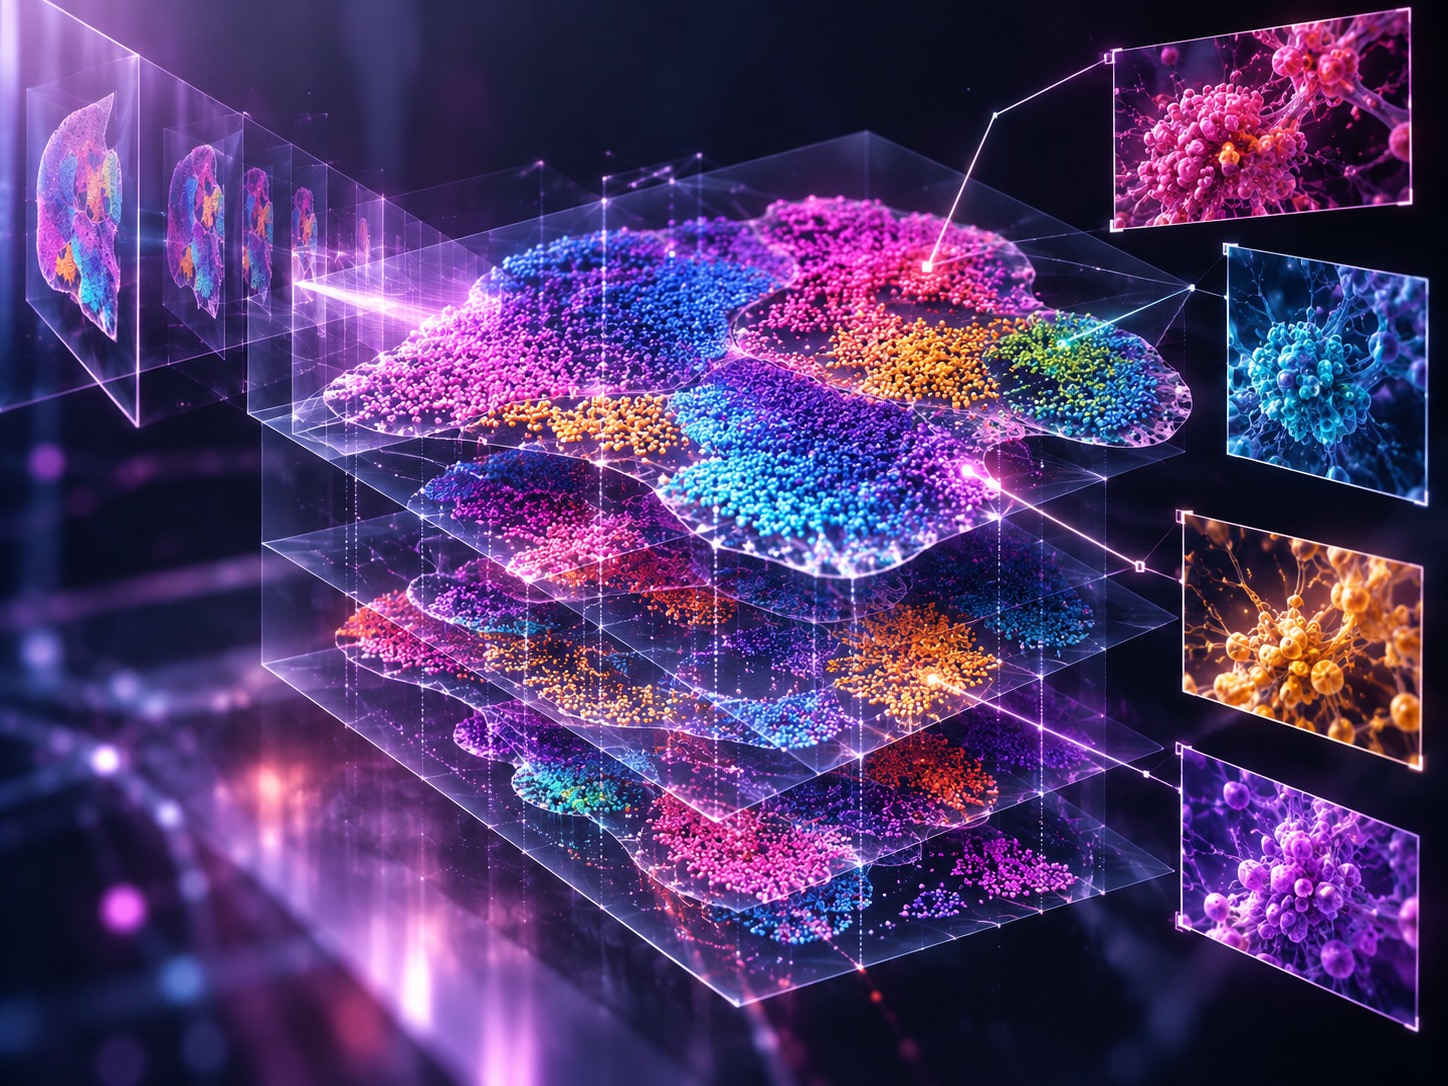
Editor2026-10-05T09:05:02+00:00New Spatial GWAS Atlas Maps Disease Variants to Specific Cells and Tissue RegionsEditor2026-10-05T09:05:02+00:00October 5, 2026|
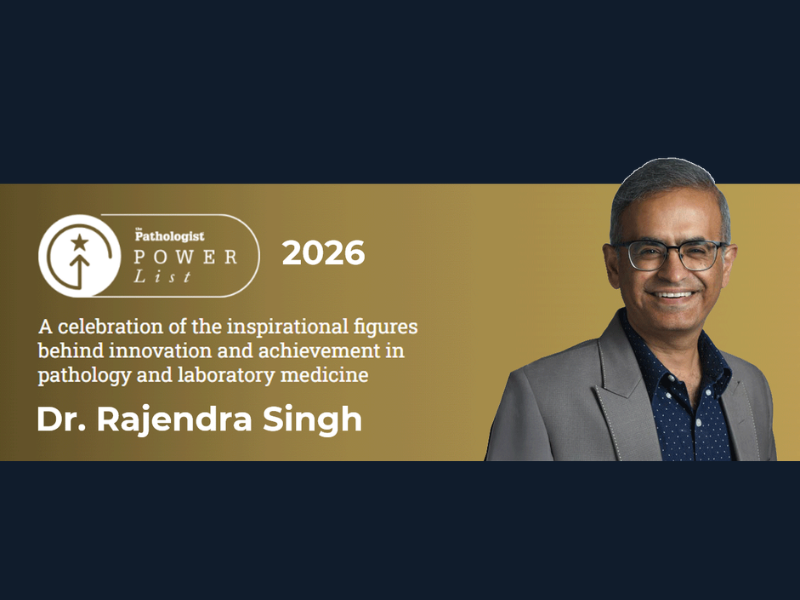
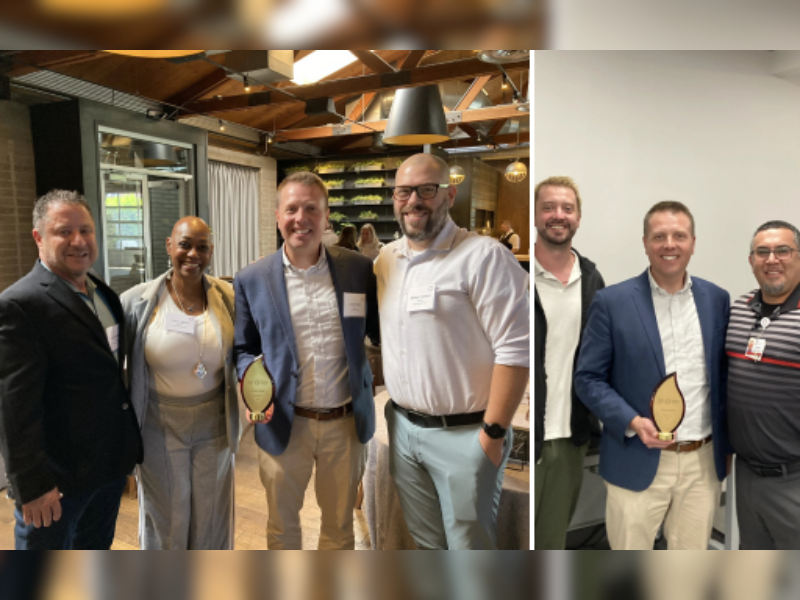
Editor2026-10-05T08:53:58+00:00PathPresenter co-Founder Dr. Rajendra Singh named to The Pathologist’s Power List 2026Editor2026-10-05T08:53:58+00:00October 5, 2026|
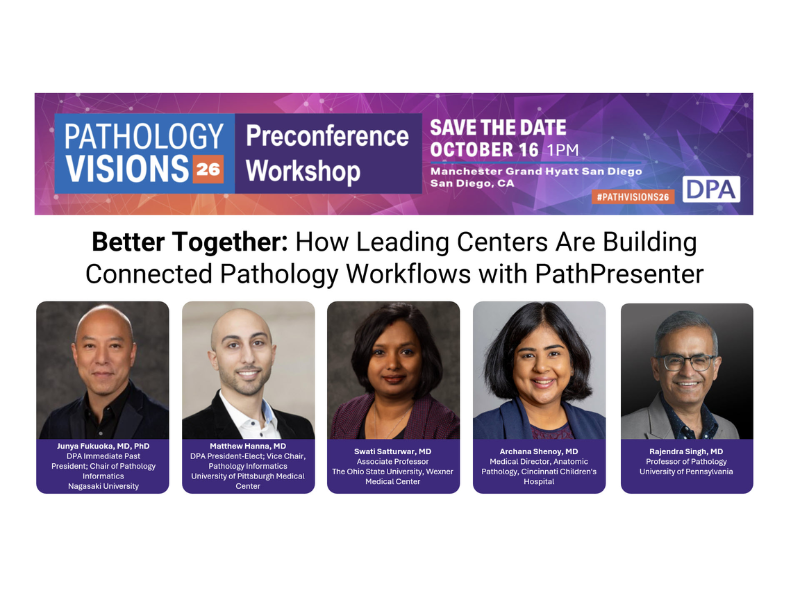
Editor2026-10-02T08:40:33+00:00PathVisions2026 Workshop: How Leading Centers Are Building Connected Pathology Workflows with PathPresenterEditor2026-10-02T08:40:33+00:00October 2, 2026|
Editor2026-10-02T08:15:27+00:00Imagene AI and CellCarta Expand Collaboration to Validate, Deploy and Scale AI-Powered Biomarker and Companion Diagnostic Programs Across Drug DevelopmentEditor2026-10-02T08:15:27+00:00October 2, 2026|
Editor2026-10-02T09:30:56+00:00In Conversation with Nasir Rajpoot, TIA Centre (University of Warwick) – Episode 3Editor2026-10-02T09:30:56+00:00October 1, 2026|
Editor2026-10-01T08:24:33+00:00Innovators at the Table: The Right Treatment for the Right Patient – PodcastEditor2026-10-01T08:24:33+00:00October 1, 2026|
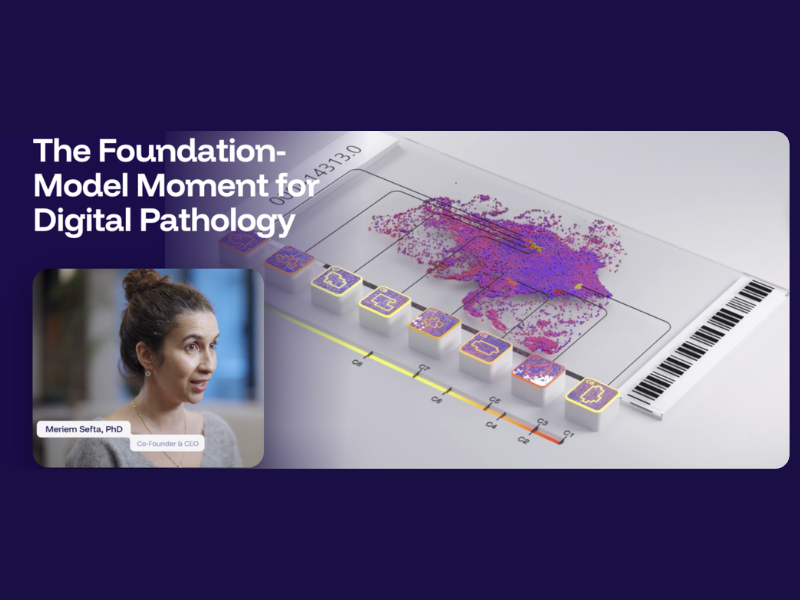
Editor2026-09-29T12:38:55+00:00Foundation Models for Digital Pathology: How Waiv Is Changing Cancer DiagnosticsEditor2026-09-29T12:38:55+00:00September 29, 2026|
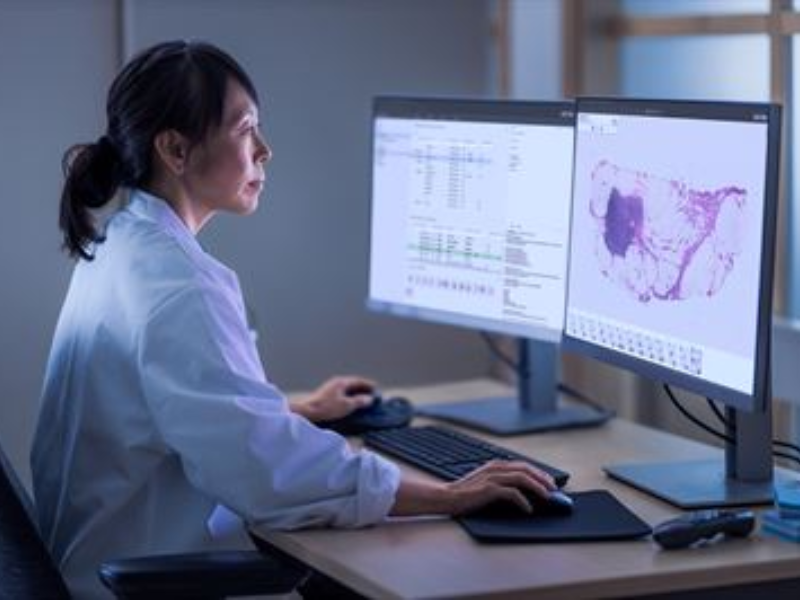
Editor2026-10-05T09:25:10+00:00UK digital pathology provider Source BioScience selects Sectra to enable seamless pathology collaboration across the NHSEditor2026-10-05T09:25:10+00:00September 29, 2026|
Editor2026-09-28T13:36:51+00:00Leica Biosystems Completes Acquisition of StatLab to Bolster Delivery of More Precise, Timely Diagnostics for Cancer PatientsEditor2026-09-28T13:36:51+00:00September 28, 2026|
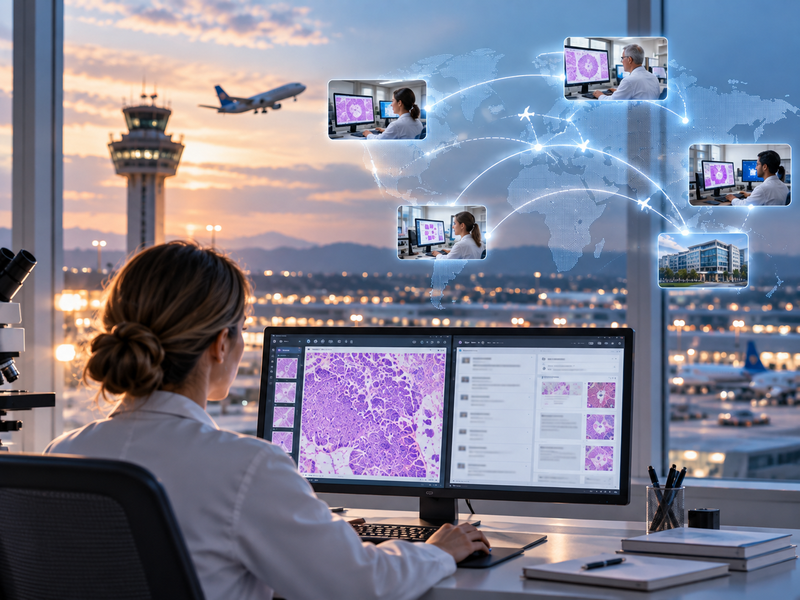
Branko Perunovic2026-09-28T10:24:25+00:00Forget Location: Part 2, Coherence Without Co-locationBranko Perunovic2026-09-28T10:24:25+00:00September 28, 2026|
Editor2026-09-28T09:42:59+00:00Source BioScience Expands Access to Hereditary Cancer Testing to Support Informed Patient CareEditor2026-09-28T09:42:59+00:00September 28, 2026|